
Projections
The nautical chart is a 2-dimensional representation of a 3-dimensional world. And although this results in various distortions, as long as two requirements are met we can use this image for navigational purposes.- The angles between three objects in the chart should be the same as the angles between the real objects which they represent.
- A straight course should appear as a straight line in the chart.
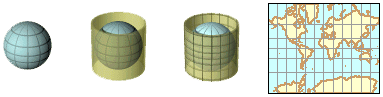
A well known method to create such a chart is called the Mercator projection after Gerard “Mercator” Kremer
But where the meridians converge on the globe they run parallel in the projection (see chart below), indicating the distortion. Look, for example, at a high parallel. The length of such a parallel on the globe is much smaller than the equator. Yet, on the chart they have exactly the same length creating a distortion which gets bigger nearer to the poles. The figure below shows the construction of the Mercator projection. From this it is clear that only the vertical scales should be used for measuring distances.
 |  |
 The vertical scale depicted on the right demonstrates the distortion. The two little navy coloured markers have precisely the same size, the upper one measures only 0.64 degrees (= 38.4 nm) while the other measures 1.00 degrees (= 60 nm). So, distances (in degrees or in miles and minutes) should not only be read on the vertical scale, but also at approximately the same height. The horizontal scale is only valid for one latitude in the chart and can therefore only be used for the coordinates (a point, but not a line). If you divide the surface of the earth in eight pieces, and lift one out and project it, you end up with the figure below.
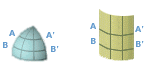 The result is that both A-A' and B-B' are now as long as the bottom of the chart and are “too long”.
 But there are of course other projections in use by sailors. An important one is the Stereographic projection, which is constructed by projecting on a flat plane instead of a cylinder. On this chart parallels appear as slightly curved and also the meridians converge at high latitudes. So, strictly speaking, a straight course will not appear as a straight line in the chart, but the parallels remain perpendicular to the meridians. Most often, distortions are scarcely noticed when this projection is used to chart a small area. Like the Mercator projection, the vertical scale represents a meridian and should be used for measuring distances.
Another projection is the Gnomeric projection on which the meridians are again converging. But most importantly, the parallels are arcs of a circle while great circles appear as straight lines. On a sphere the shortest route between A and B is not a straight line but an arc (part of a great circle). Though this is also true when you – for example – cross a little bay, we use for simplification a loxodrome (a handy straight line on your Mercator chart which does not reflect your shortest route). On a Gnomeric chart this same loxodrome is an arc, while your shortest route (a great circle) ends up as a straight line. Hence, the gnomeric projection is particularly useful when sailing great circles (like when you dabble in circumnavigation) and is beyond the scope of a coastal navigation course.
Organization of the chart
- Authority: The publisher responsible for the information in the chart – “British Admiralty Charts”.
- Title: The title gives a description of the area covered by the chart – “The Aegean Sea of Greece - Athens to Rhodes”.
- Number: Different chart types of the same area can be distinguished by the chart's number.
- Projection: Most likely the Mercator projection as described above. Charts covering small areas can be constructed by stereographic projection.
- Scale: For example: 1:193.000. But since the chart is distorted this holds only for one specific latitude in the Mercator chart. The scale indicates how detailed the chart is (here 1 cm on the chart represents 193000 cm on earth).
- Horizontal geodetic datum: The definition of the relationship between the ellipsoid adopted as the model of the Earth's shape, and the Earth itself. Though there are hundreds of datums in use, most are only locally valid.
Yet, the WGS-84 datum is global in scope and positions obtained by satellite navigation systems are usually referred to this datum. Therefore, a correction needs to be applied to a WGS-84 GPS position to agree with charts using other horizontal datums. For example to correct WGS-84 to the European datum, add 0,06'N , 0,04'E (style guide) to the WGS-84 position indicated by the GPS. Fortunately, most GPS receivers may be set to display positions in several other datums besides WGS-84 and perform the calculations for you.
 - Chart sounding datum: The tidal datum to which soundings and drying heights on a chart are referred. Often shortened to “chart datum” when it is clear that reference is not being made to a horizontal datum. Chart sounding datums are also used as reference for heights (lighthouses, mountains, bridges). Multiple datums can be used in one chart: L.A.T. for soundings and M.L. for heights.
- Soundings & height units: Soundings and heights can be stated in - for example - metres, feet or fathoms. Today all charts worldwide are metric, except for USA Hydrographic Office charts, which sometimes still use feet instead of the international standard.
- Horizontal scale: Natural scale at for example 40° 15,3' S latitude where the horizontal scale can be used for measuring distances and where the chart scale is true.
- GPS compatibility: Most charts neither have the precision nor the resolution to fully use the (differential) GPS positioning potential. Moreover, still plenty of charts result from surveys done in the 19th century.
Also, GPS data often requires a correction for a local horizontal chart datum before it can be used in the chart. - Corrections & edition: The chart is for example a 2009 edition but is - when properly corrected - still valid in 2012. Corrections are published continuously and the changes made should be mentioned in the bottom left corner of the chart.
Information in the chart
- Depths reduced to chart datum: A sounding like 35 indicates 3½ metres of water under Lowest Astronomical Tide (when the chart datum is “L.A.T.”). An underlined sounding like 04 indicates a height of 40 cm above L.A.T..
Heights above Chart Datum on drying areas are given in metres and decimetres. The metres figure is underlined.
Depths are given from 0.1 to 20.9 in metres and decimetres, and from 21 to 31 in metres and half metres. Greater depths are rounded down to the nearest safest metre (for example, 32.7 metres is rounded down to 32 metres).
The geographical position of a sounding is the centre of the depth figure. - Isobaths: Lines connecting positions with the same depth: depth contours.
- Heights reduced to chart datum: Heights of for instance, lighthouses, mountains and cliffs are more often reduced to another datum such as Mean High Water (M.H.W.) or Mean High Water Spring.
- Tidal information: Details of both the vertical and the horizontal movement of the water is often included in the chart.
- Lighthouses, Buoys & marks: Lights, lateral and cardinal marks,
- Seabed qualities: Pebbles, seaweed, rocks, wrecks, pipelines, sand and other seabed characteristics for anchoring.
- Magnetic variation: The angle between the true North and the magnetic North varies in place and time. The local variation is indicated in the compass card, see
- Landmarks: conspicuous positions on the shore: Churches, radio masts, mountain tops, etc. that can be used for compass bearings and other means of navigation, these will be put to good use in
Coordinates and positions
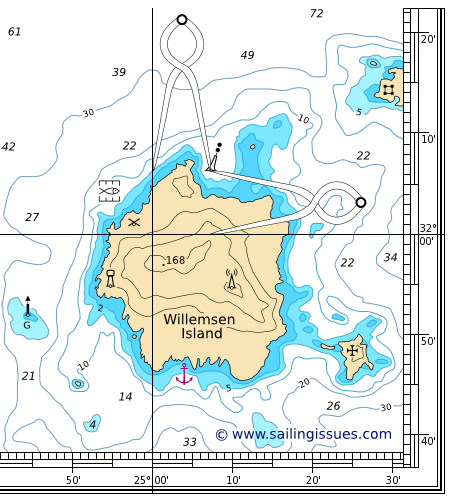
A pair of nautical dividers (single handed dividers) is used to obtain precise coordinates from the chart. This device enables you to take the distance between that particular position and the closest grid line. You then place the dividers on the scale with one end on this grid line, leaving the other end precisely at your coordinate. Do this twice to get both latitude and longitude at the scale on the edge of the chart.Below are some examples.
| Danger mark 32° 06,3' N , 25° 07,3' E |
| |||
| Fish farm 32° 04,4' N , 24° 54,7' E | ||||
| Anchorage 31° 46,0' N , 25° 04,0' E | ||||
| Church 31° 48,4' N , 25° 25,0' E | ||||
| Windmill 32° 01,0' N , 24° 57,8' E | ||||
| Castle 32° 14,2' N , 25° 29,6' E | ||||
| Water tower 31° 54,9' N , 24° 54,8' E | ||||
| Radio mast 31° 54,8' N , 25° 10,0' E | ||||
| Beacon green 31° 52,0' N , 24° 44,3' E |
Another possible notation of 33° 28,5' E is 33° 28′ 30" E, which however doesn't easily allow for more precision like 33° 28,500' E does. Also note that in most countries a comma - and not a dot - is used as the decimal separator. So instead of 33° 28.500' E, the consensus notation for mariners is 33° 28,500' E.
Distances
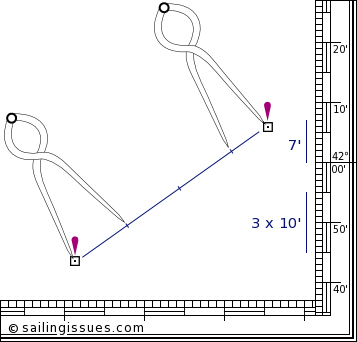 To measure the distance between, for instance, these two oil rigs, we will again need our dividers. Remember, we can only use the vertical scale. We first take a convenient distance like 10' (10 nautical miles) on the vertical scale using the middle latitude. Then we start walking with the dividers from the southern oil rig to northern one. Finally, we adjust the dividers to measure the small remaining part at its own height, i.e. its own latitude
The image shows that the total distance is 37 nautical miles.
Courses
So, now we can measure distances and both plot and read out positions, but we also need directions. For example we need to find the course from safe-water buoy A to safe-water buoy B. To accomplish this we may use parallel rules as shown in this chart below: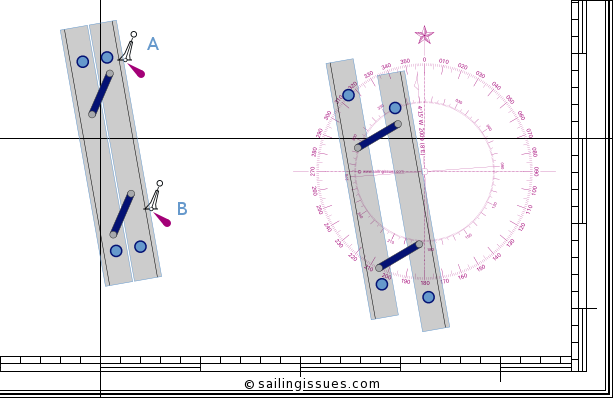 |
First you line this instrument up with the two buoys. Then follows the intriguing part in moving the device to the compass rose without losing its alignment. Finally, when one of the rules is aligned with the heart of the compass card, you can read course A – B. In this example: 170°.
Besides the parallel rules there are other types of instruments available, notably the Breton plotter - also known as a Portland Course Plotter - which features an adjustable rose.
Selection of chart symbols
| Danger line in general | |
| Wreck, least depth unknown but usually deeper than 20 metres | |
| Visible wreck | |
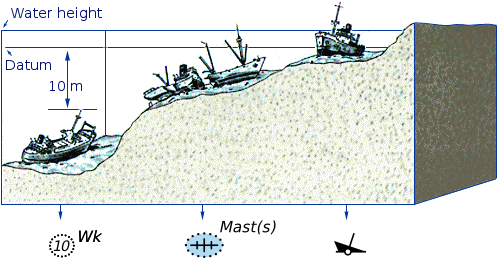
| Wreck of which the mast(s) only are visible at Chart Datum | |
| Wreck, least depth known obtained by sounding only | |
| Wreck, least depth known, swept by wire drag or diver | |
| Rock which covers and uncovers, height above Chart Datum | |
| Rock awash at the level of Chart Datum | |
| Underwater rock of unknown depth, dangerous to surface navigation | |
| Underwater rock of known depth, dangerous to surface navigation | |
| Remains of a wreck, or other foul area, non-dangerous to navigation but to be avoided by vessels anchoring, trawling etc. | |
| Depth unknown, but considered to have a safe clearance to the depth shown | |
| Sounding of doubtful depth; Existence doubtful; Reported, but not confirmed | |
| Position approximate; Position doubtful | |
| Wind turbine | |
| Chimney | |
| Tower; radio/television tower | |
| Monument | |
| Marina - boat harbour | |
| Mosque, minaret | |
| Silo | |
| Tanks | |
| Placeholder examples: Church (Ch) Tower (Tr) Hotel Cupola (Cu) Chimney (Chy). CAPITALS indicate that the landmark is conspicious. | |
| Quarrie, mine | |
| Major light; minor light | |
 | Limit of safety zone around offshore installation |
| Position of tabulated tidal stream data with designation “A”; Tidal levels data “a” | |
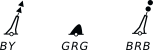
| Green or black buoys (symbols filled black): G = Green ; B = Black | |
| Single coloured buoys other than green and black: Y = Yellow ; R = Red | |
 | Multiple colours in horizontal bands, the colour sequence is from top to bottom |
| Multiple colours in vertical or diagonal stripes, the darker colour is given first. W = White | |
| Lighted marks on multicoloured charts, GPS displays and chart plotters. A yellow coloured lobe indicates a White light! Also note that beacons (here the rightmost symbol with the green light) has an upright G, instead of an oblique G |
Glossary
- Mercator projection: Most coastal nautical charts are constructed with this method. Angles are true and distances can be measured using the vertical scale.
- Stereographic projection: Used for chart covering small areas. Like the Mercator projection use the vertical scale to measure distances.
- Gnomeric projection: Used for vast areas. Great circles appear as straight lines on the chart.
- Great circle navigation: The shortest course on earth between two positions is a great circle; for circumnavigating and ocean crossings.
- Loxodrome: A line which makes the same angle with all meridians. Theoretically not the shortest route, but a handy straight line on a Mercator chart.
- Horizontal geodetic datum: Defines the relationship between the ellipsoid adopted as the model of the Earth's shape, and the Earth itself. Coordinates which refer to, for instance, AIA
 should be corrected before plotting them in a chart based on another horizontal datum. If your GPS receiver consistently disagrees with known positions by a constant amount and direction, then check that you have set it to display the correct horizontal datum.
 - Chart sounding datum: The tidal datum (fictitious plane) to which soundings, heights, elevations and drying heights on a chart are referred.
- Vertical scale: Distances in nautical miles or minutes (') should be measured at the same latitude on the vertical scale.
- Corrections: Each chart is liable to corrections which are published by either a national body or the publisher of the nautical chart.
No comments:
Post a Comment